Heat Map

The Heat Map tool allows determining where visitors stop and measuring their linger time in areas of interest (promo stands, showcases, product placement areas, ads, etc.). With the detection tool, it is possible to view the "warmest" places at a retail store or any other trafficked location thanks to corresponding visual cues on screen.
Benefits of using the Heat Map
- Measure the effectiveness of direct advertising (display videos, brochures, ad posters, banners, etc.) by determining how long visitors stay in these locations and calculating the ROI on ad expenses.
- See where to direct your promotional efforts: compare the effect of different promotions for a particular product over time; and identify the areas of your store that are most promising for events and promotions.
- Knowing the most highly trafficked store areas, you can adjust the layout of the store to eliminate bottlenecks and "cold" areas.
- Determine the effectiveness of your product placement, in order to optimize financial propositions for product manufacturers.
- Compare the effectiveness of different places in your store for sales of a particular product.
- Scale out successful experiments with store arrangements, layout, and promotions to other stores in your chain.
- Plan staff numbers and stationing more efficiently.
- Measure overall store operations and workload.
Main tool functions
- Measure visitor activity in an area.
- Record visitor activity events to a database.
- Use quantitative data for reporting on visitor activity in different areas of a store.
Report forms
Visitor activity for any period of time can be viewed as a web report. The report can be saved as a file or sent by email automatically (according to a schedule).
Two types of reports to choose from:
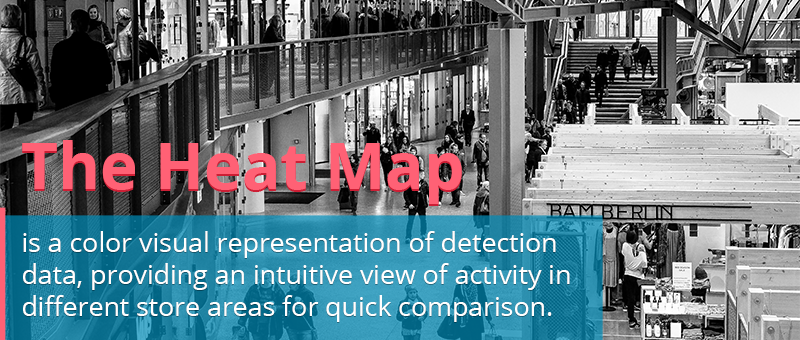
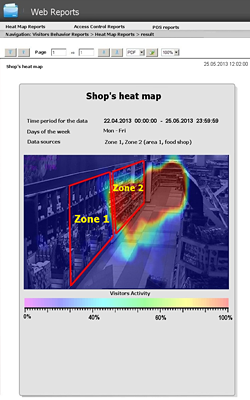
The Heat Map is a color visual representation of detection data, providing an intuitive view of activity in different store areas for quick comparison.
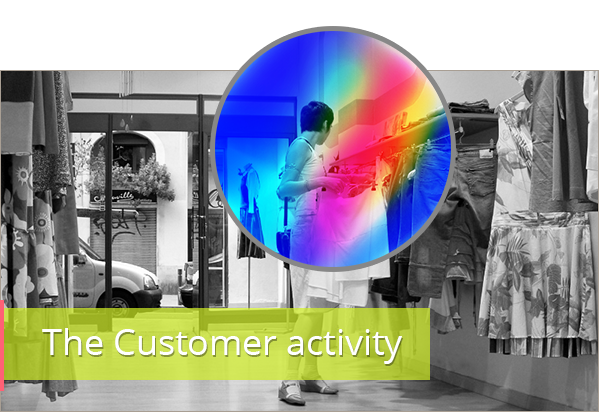
Detection data for a user-selected time period is used. "Warm" colors correspond to longer linger times in a particular place, while "cold" ones mean a lack of visitor interest. This offers an at-a-glance summary of which areas customers find attractive.

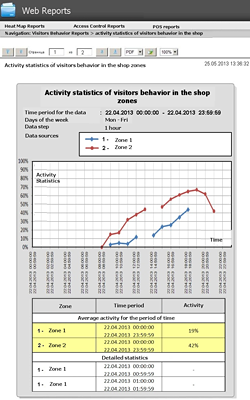
The Customer activity statistics report presents detection data in the form of charts and tables for analysis and comparison of visitor behavior in areas of interest. This form offers rigorous quantitative information on changes in visitor activity by zone and over time.
Detection data for a user-selected time period is used. Users receive up-to-date information on changes in visitor activity by zone over time as well as the average value for all time recorded. Data for different zones can be compared for even deeper analysis.
Understanding customer behavior: Heat Map
